Machine Learning for energy professionals course (New)

Join our founding cohort of this new course with a special price of €999 for three full days across three weeks from 29 Oct till 12 Nov.

Register for Machine Learning for energy professionals course (New)

Submit your details below to learn more about the curriclum

Energy markets are changing faster than the models built to follow them.

For years, many trading and analytics teams followed the market with spreadsheets and models built on stable price history. Prices behaved in fairly predictable ways, and a manual approach was often enough.

That's no longer the case. More wind and solar means more volatility, more hours with negative prices and more sudden shifts in how the market behaves. The day-ahead market now trades in 15-minute products. There's more data, arriving faster, than any team can work through by hand.

At the same time, AI tools can build a forecasting model in minutes. They can't tell you if it's any good. A model can look excellent in a backtest, a test on historical data, because future data leaked into its training by mistake. Spotting that takes an understanding of machine learning, not a better prompt.

What you'll learn

This course shows you how to build, check and explain machine learning models for European energy markets, in a world where AI writes much of the code. It's built for analysts, traders, portfolio managers and risk managers. You work in Python in Google Colab, using real spot prices and forward curves pulled live from the Energy Quantified (EQ) API. Everything runs in your browser, so there's nothing to install.

Over three live online days, a week apart, you move from the foundations of machine learning to tree-based models, deep learning and AI coding assistants. The focus is on knowing which model fits which problem, how to test it properly and how to explain the result.

This training course will teach you how to:

  • Decide when machine learning beats traditional econometrics, and when it doesn't.

  • Prepare messy data from several sources and turn it into useful model inputs.

  • Build and compare forecasting and classification models on real spot and forward curve data.

  • Test time series models properly, and spot when a model only looks good because of overfitting or data leakage.

  • Explain what a model does, and how uncertain its forecasts are, to traders, risk committees and management.

  • Use AI coding assistants such as Gemini, Copilot and Claude to build faster, and review what they produce.

  • Pull energy market data straight from an API into your own models.

You’ll benefit most from this training if you:

Work in analysis or trading

  • Build or use price forecasts and want a process you can trust, from raw data to tested model.

    Want to test trading signals and spot shifts in market behaviour on spot and forward curve data.

Manage risk or portfolios

  • Need machine learning results you can explain and defend in front of a risk committee.

  • Want to see the structure in your forward curves and understand how uncertain your forecasts are.

Lead a team or work alongside one

  • Head an analytics, trading or risk team and want to upskill it on the data it already uses.

  • Work in strategy, commercial, IT or data roles and want to know what machine learning can and can't do for energy markets.

This course is a good fit if you work with energy market data and need models you can trust, whether you build them yourself or brief an AI assistant or data team.

You don't need any machine learning experience, but you should be comfortable working with data and basic statistics. If you're new to Python, the pre-course module covers the basics.

If you are unsure whether it fits your role, just ask. We are happy to help you decide.

For questions, please contact:

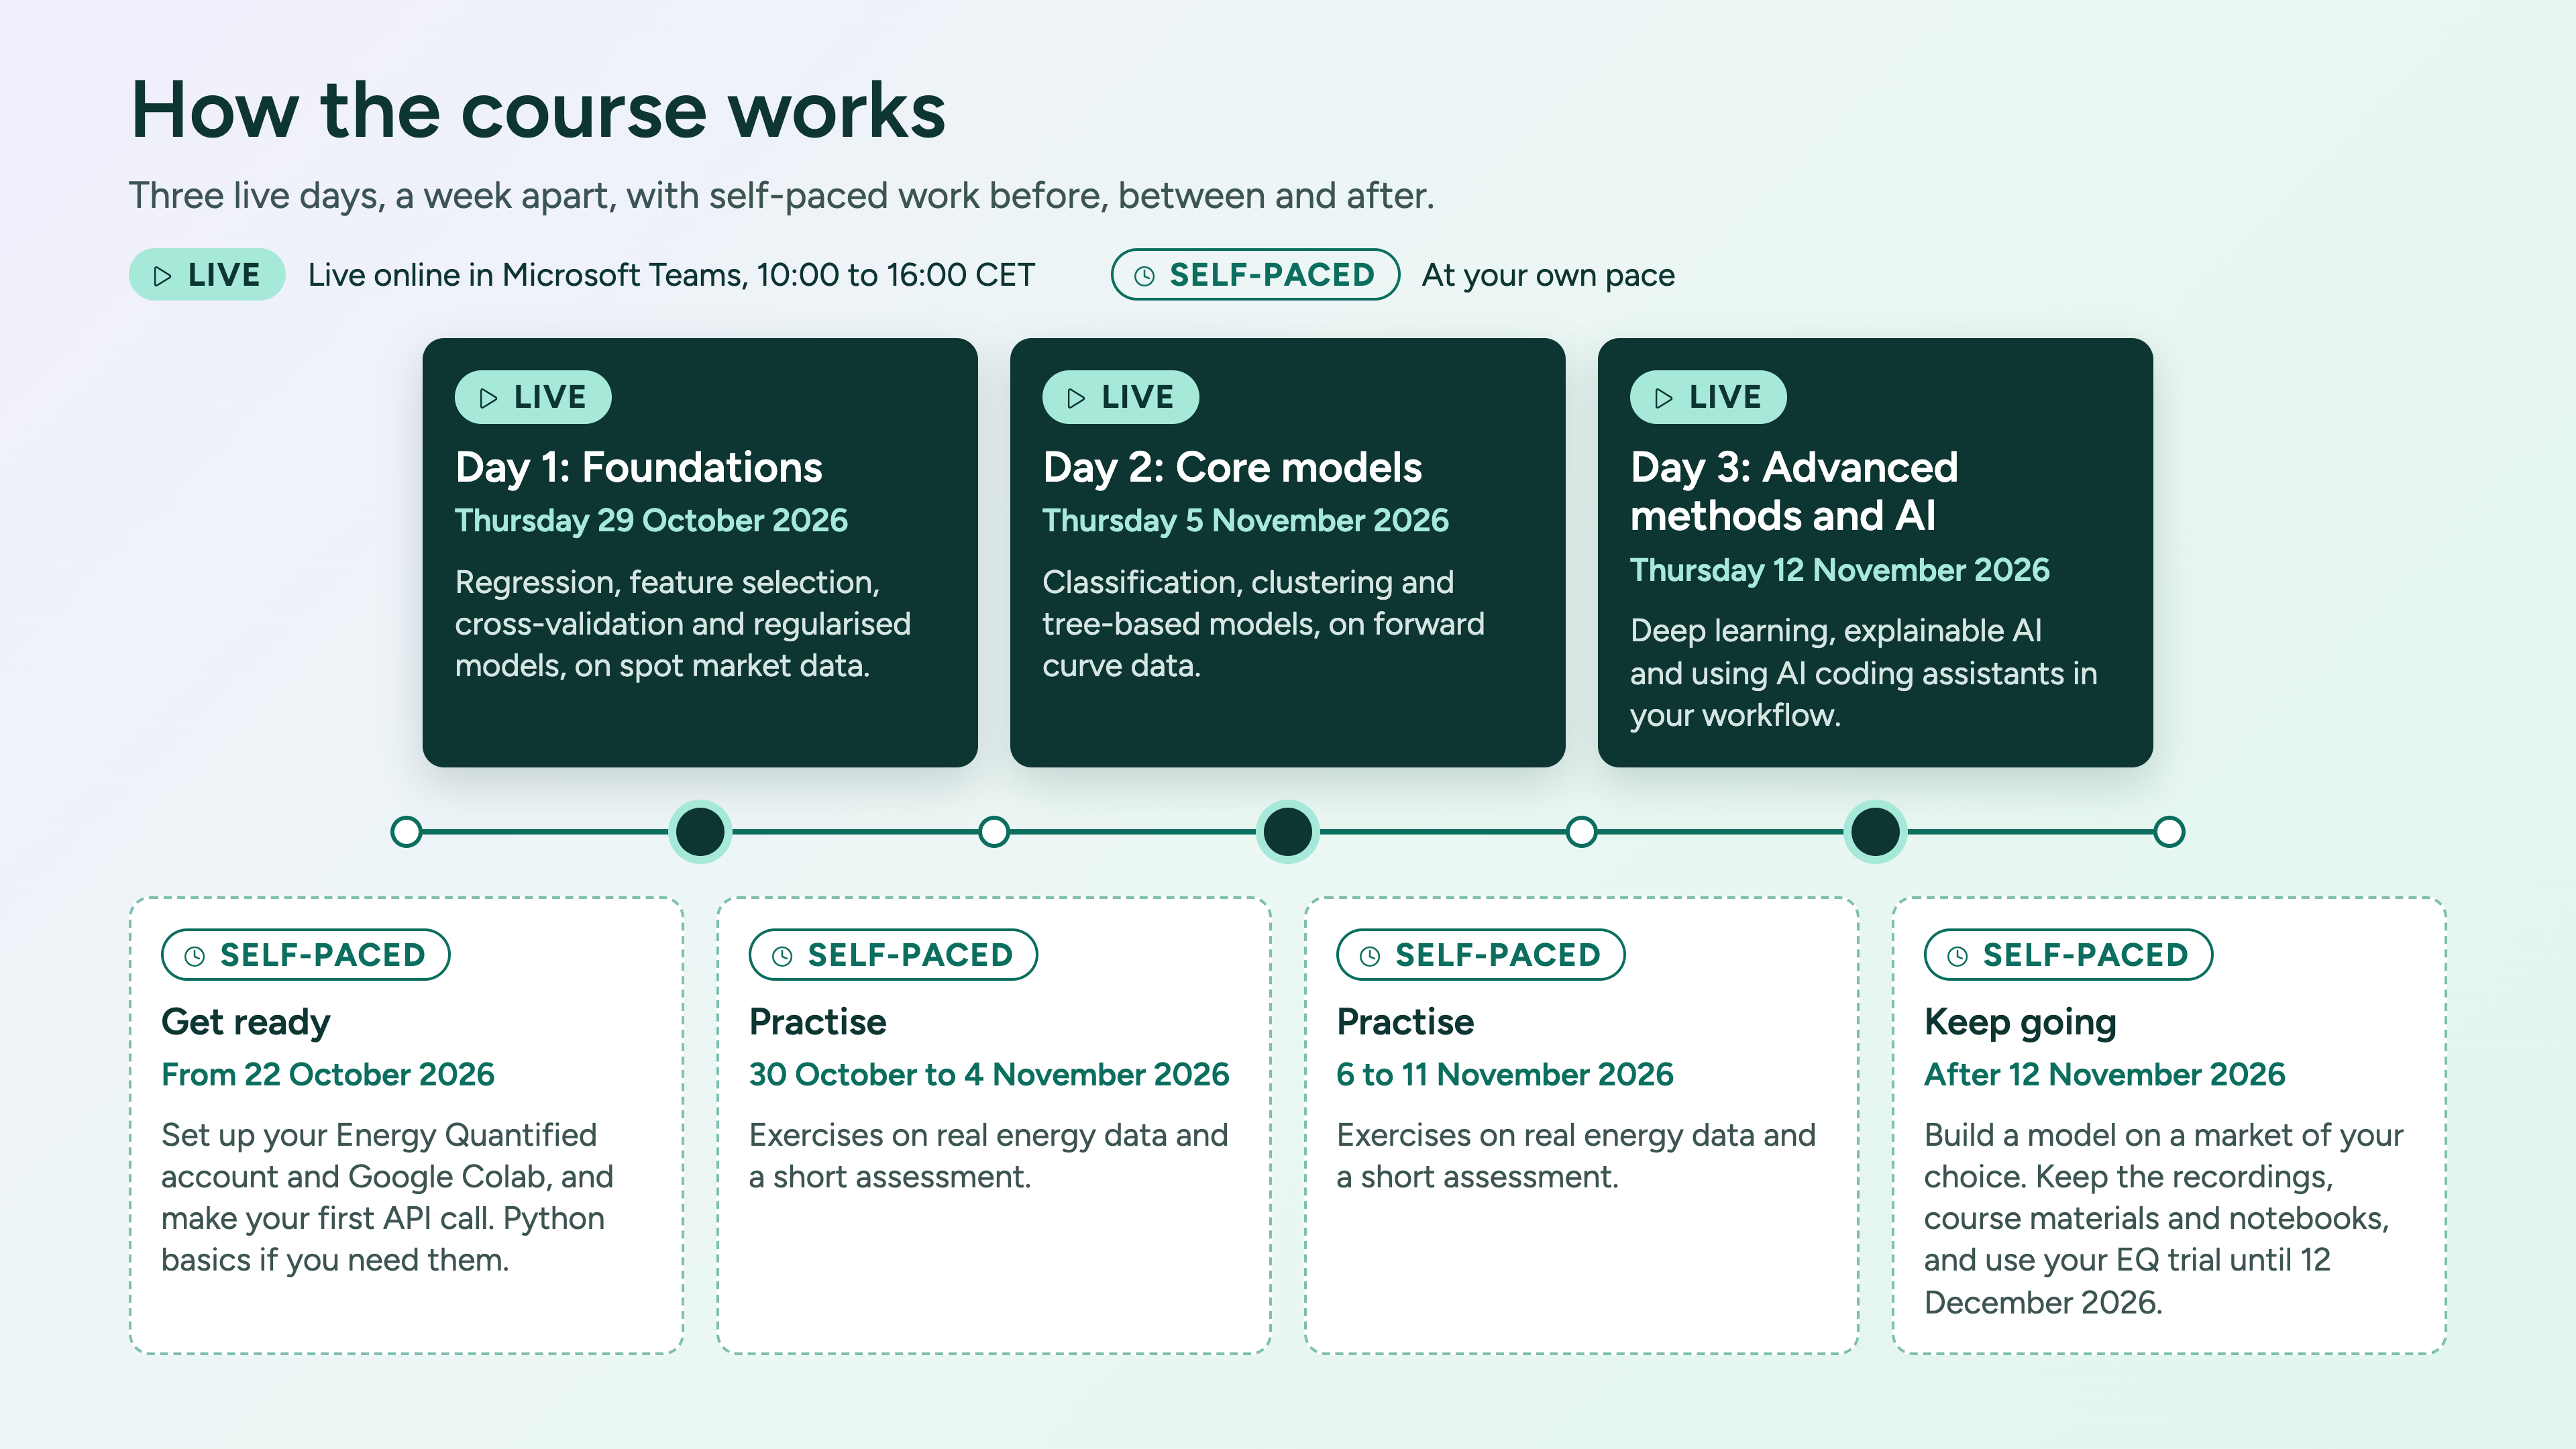
Before day 1 (self-paced): getting ready

  • Warm-up reading (about 30 minutes)

  • Technical setup (about 15 minutes): activate your EQ account and API key, and set up Google

  • Colab and Gemini in Colab

  • A first task: run the setup notebook, which makes your first EQ API call and plots real prices

  • Python basics, if you need them

  • Your EQ trial starts when you activate your account.

Day 1 (live): foundations

Thursday 29 October 2026 · 10:00 to 16:00 CET · Spot market data

  • Introduction to AI and Python, and machine learning compared with econometrics

  • Linear regression

  • Feature selection and feature engineering

  • Cross-validation and model selection

  • Regularised linear models (LASSO, Ridge, Elastic Net), parts 1 and 2

Between day 1 and 2 (Self-paced)

  • Linear regression and regularised model exercises on an energy dataset

  • A case study on feature selection and common mistakes

  • A short assessment

09:15 – 10:00: Introduction to Energy Markets and Financial Returns

  • Energy markets overview: electricity, gas, oil, coal, carbon

  • Spot, futures, and options markets

  • Key price characteristics:
    - Volatility clustering
    - Fat tails and skewness
    - Mean reversion and seasonality

  • Return calculation and analysis
    - Descriptive statistics (mean, variance, skewness, kurtosis)
    - Visualization: histograms, time series, QQ plots

Hands-on: Return calculations and visual diagnostics in Excel/Python/R

10:00 – 10:15 Break

10:15 – 11:00: Risk Measures in Energy Markets

  • Key measures: volatility, correlation, VaR, Expected Shortfall

  • Historical vs. parametric approaches

  • How risk evolves over time (e.g. rolling volatility and exponential weighted volatility)

  • Interpreting and comparing tail risk in different markets for long and short positions

11:00 – 11:15 Break

11:15 – 12:00: Volatility Modelling

  • Volatility modelling approaches:
    - EWMA
    - GARCH family (normal, t, skewed t, cornish fisher, evt)
    - Realized volatility from high-frequency data
    - Implied volatility from option markets

  • Model diagnostics and forecasting

12:00 – 13:15 Lunch break

13:15 – 14:00: PCA and Correlation Modelling

  • Estimating dynamic covariances: EWMA, rolling windows

  • Multivariate volatility models:
    - Constant and dynamic conditional correlations (CCC, DCC)

  • Principal Component Analysis (PCA):
    - Interpreting forward curve shapes
    - Reducing dimensions for large correlation matrices

  • Hands-on: PCA on energy futures curves in R/Python

14:00 – 15:15 Break

15:15 – 16:00: Copulas

  • Understanding tail dependencies and non-linear relationships between assets

  • Understanding different stand alone distributions for different assets

  • Risk management using copula models

  • Hands-on: Copula-based dependency modelling in Excel/R/Python

Day 2 (live): core models

Thursday 5 November 2026 · 10:00 to 16:00 CET · Forward curve data

  • Classification and logistic regression

  • Advanced classification

  • Unsupervised learning: principal component analysis (PCA)

  • Clustering (K-means)

  • Tree-based methods (Random Forest, XGBoost, LightGBM), parts 1 and 2

Between day 2 and day 3 (self-paced)

  • PCA, K-means and tree-based exercises on an energy dataset

  • A short assessment

Day 3 (live): advanced methods and AI in your workflow

Thursday 12 November 2026 · 10:00 to 16:00 CET

  • Deep learning: MLP, CNN, RNN and LSTM networks, parts 1 and 2

  • Explainable AI (XAI): local and global models

  • Probabilistic AI

  • AI tool integration: Gemini, Copilot and Claude agents to speed up your workflow

  • Final overview and wrap-up

After course materials (self-paced)

  • A deep learning exercise on an energy dataset

  • Own-data challenge: build one model on a market of your choice with EQ data, and share the result in

  • the course community

  • Further reading on AI tool integration

  • Your EQ trial runs until 12 December 2026, so you can keep working on your own markets.

Speakers

Sjur Westgaard

MSC AND PHD OF INDUSTRIAL ECONOMICS FROM NORWEGIAN UNIVERSITY OF SCIENCE AND TECHNOLOGY AND A MSC OF FINANCE FROM NORWEGIAN SCHOOL OF BUSINESS AND ECONOMICS

Sjur Westgaard is a Professor of Finance at the Norwegian University of Science and Technology (NTNU) and an Adjunct Professor at Inland Norway University of Applied Sciences, where he is affiliated with the Center for Business Analytics. His work focuses on financial risk management, energy and commodity markets, and economic and financial forecasting.

He has extensive experience from both academia and industry, having previously worked as an investment portfolio manager for an insurance company, a project manager in consulting, and a credit analyst in an international bank. His teaching and research cover corporate finance, derivatives, empirical finance, and risk modelling, with a particular emphasis on risk forecasting in energy and commodity markets.

Sjur is one of the founders and editors of the Journal of Commodity Markets and serves as an associate editor of the Journal of Energy Markets. He has led and contributed to several large research projects involving energy companies, academic institutions, and the Research Council of Norway.

Morten Risstad

Associate Professor Department of Industrial Economics and Technology Management Norwegian University of Science and Technology

Morten Risstad is an Associate Professor at the Department of Industrial Economics and Technology Management at the Norwegian University of Science and Technology (NTNU). His academic work focuses on empirical finance, asset pricing, derivatives, and financial risk management.

He holds a PhD in Industrial Economics and Technology Management from NTNU, an MSc in Finance from Nord University, and is a Certified European Financial Analyst (CEFA) from NHH. Prior to joining academia, Morten worked in consulting, multinational industrial companies, and financial institutions, with roles related to financial reporting, corporate finance, trading, and risk management.

Morten is also part of the research team at the Norwegian Open AI Lab, where he contributes to research at the intersection of data, analytics, and decision-making.