Interconnector flows
Simplify your data sourcing and track interconnector flows from 33 European countries.
Overview
All the information you need to track cross-border flows and understand the associated impacts on the energy markets you are active in:
Remaining available energy capacity on interconnectors for a given time period.
Energy prices and volumes divided by geographical area.
BritNed (UK ↔ Netherlands)
IFA & IFA2 (UK ↔ France)
NordLink (Germany ↔ Norway)
North Sea Link (UK ↔ Norway)
COBRAcable (Denmark ↔ Netherlands)
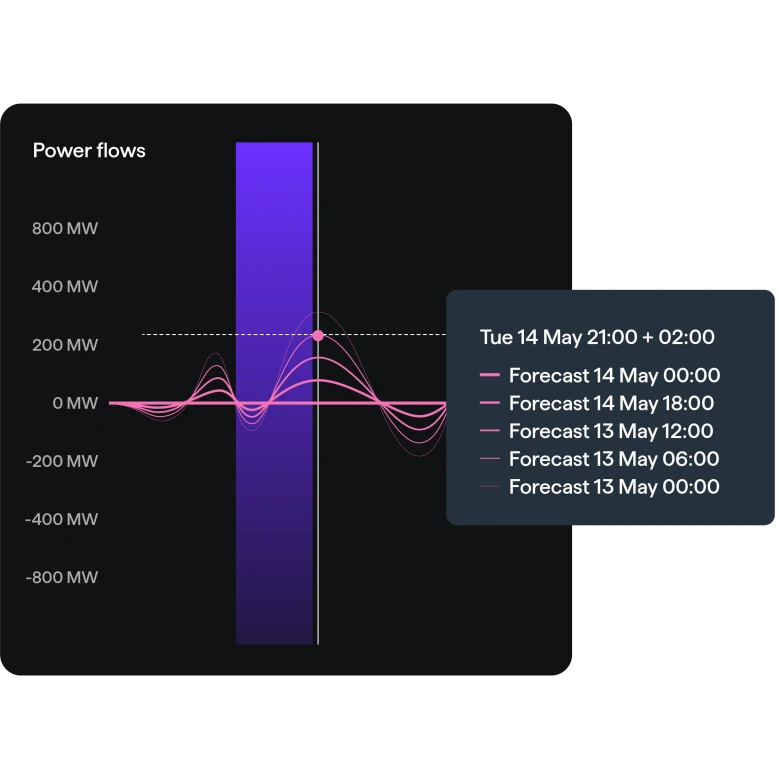
Predicted energy volumes for European interconnectors.
Track potential actions in the UK balancing market.
Confirmed power prices for explicit allocations.
See total power capacity between interconnection points.
See total volume available on interconnectors.
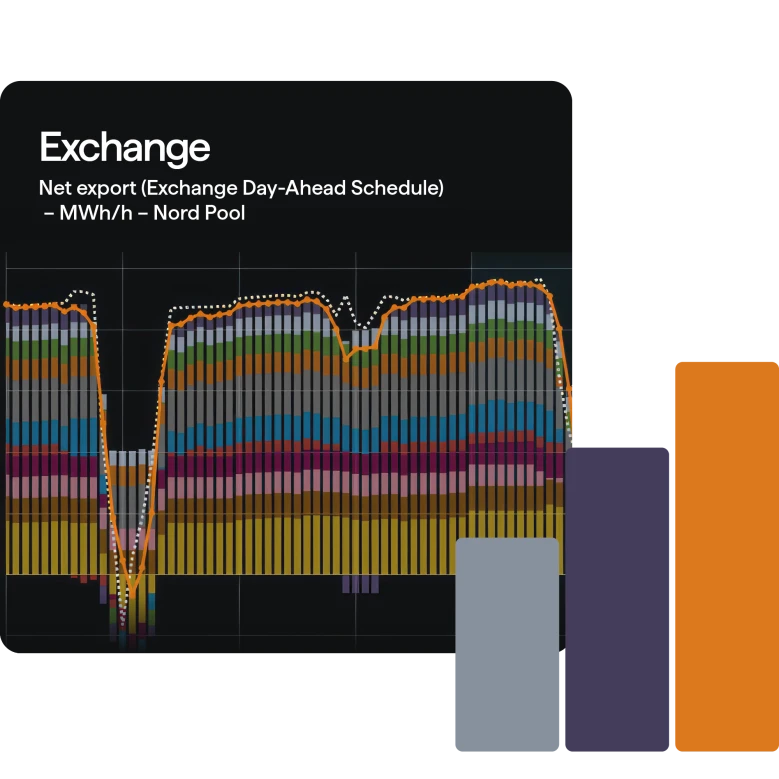
Assess general flow direction, identify constraints and see where power is flowing across Europe
See the maximum amount of energy transfer capacity between two countries joined by interconnection.
Compare expected power flows with what was actually delivered.
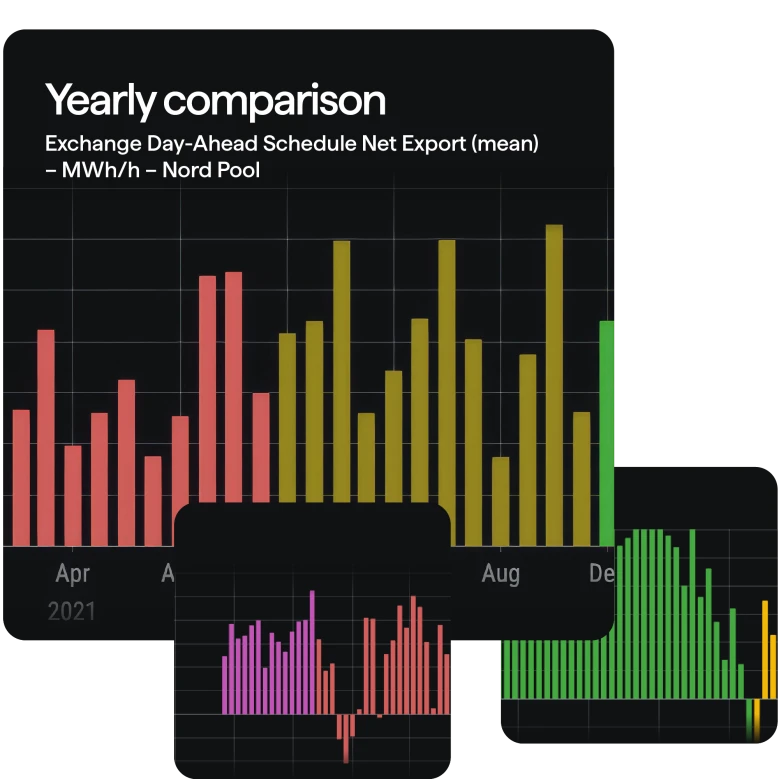
Track historical energy volumes traded between countries.
See the cost of balancing actions proposed by Transmission System Operators across Europe.
Comprehensive view
Custom screens
Data feed integrations
Try interconnector flows for free
With so much data available, Montel Analytics often requires tailored solutions. Get in touch with our product experts so we can build the exact package to meet your needs.