




Report
Analytics
Energy prices
Technical analysis
Understanding the energy market
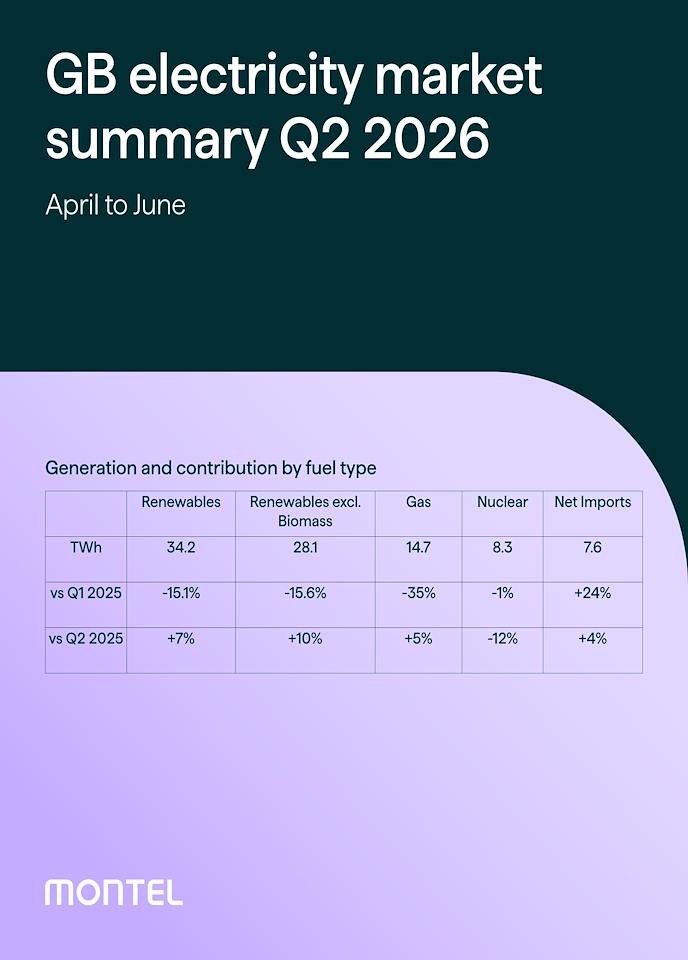
GB electricity market summary: Q2 2026
Geopolitical shocks, record solar output and a late June heatwave shaped GB power and gas prices in Q2 2026. See what drove it and what's next.
Download E-book
GB electricity market summary: Q2 2026
Q2 2026 was shaped by disruption to shipping through the Strait of Hormuz, which pushed gas prices higher and added volatility across GB and European markets through April and May. At the same time, record solar output increasingly drove intraday price patterns, contributing to more frequent low and negative wholesale prices. A record-breaking heatwave at the end of June then tightened system margins sharply, pushing balancing prices up and testing the system's flexible capacity.
This report walks through generation, demand and price data for the quarter, the operational pressures behind the headlines, and Montel's outlook for Q3.
Who should download this report?
- Traders and risk managers: anyone pricing or hedging GB power and gas exposure who needs the quarter's drivers laid out clearly.
- Asset owners and generators: particularly wind, solar and flexible/CCGT operators navigating curtailment, margins and dispatch patterns.
- Corporate energy buyers: teams tracking cost exposure and volatility ahead of Q3 procurement decisions.
- Analysts and consultants: anyone benchmarking GB market performance or briefing clients on recent developments.
Why you should download this report
- A single, clear account of a volatile quarter. Geopolitics, weather and renewables all moved the market at once — this report untangles which drove what, and when.
- Hard numbers, not just narrative. Full generation, demand and price tables by fuel type, plus year-on-year comparisons back to 2018.
- A grounded view on what's next. The Q3 outlook section sets out what the forward curve is and isn't pricing in.
- Built by analysts who watch this market daily. From Montel Energy's experts, drawing on Elexon, EPEX, Nord Pool and NESO data.
Hydrology
Energy prices
Understanding the energy market
Drained reserves: European electricity market summary Q3 2026
Low hydropower leaves Europe’s power system exposed heading into winter.
Power
LNG
Understanding the energy market
Summer heat, winter prices: GB electricity market summary Q3 2026
Rising gas prices pushed GB day-ahead power up 69% in Q3 2026.

Power
Analytics
Regulation
Understanding the energy market