





-
Tools Used: Excel, R, Python – with real-world datasets from electricity, gas, oil, coal, and carbon markets
-
09:00 – 09:15: Welcome and Course Introduction
- Overview of course objectives and structure
- Participant introductions and experience sharing
- Software/tools setup: Excel, R, Python
- Dataset overview: historical prices, forwards, spreads
-
09:15 – 10:00: Introduction to Energy Markets and Financial Returns
- Energy markets overview: electricity, gas, oil, coal, carbon
- Spot, futures, and options markets
- Key price characteristics:
- Volatility clustering
- Fat tails and skewness
- Mean reversion and seasonality
- Return calculation and analysis:
- Descriptive statistics (mean, variance, skewness, kurtosis)
- Visualization: histograms, time series, QQ plots
Hands-on: Return calculations and visual diagnostics in Excel/Python/R
-
10:15 – 11:00: Risk Measures in Energy Markets
- Key measures: volatility, correlation, VaR, Expected Shortfall
- Historical vs. parametric approaches
- How risk evolves over time (e.g. rolling volatility)
- Interpreting and comparing risk metrics
-
11:15 – 12:00: Volatility Modelling
- Volatility modelling approaches:
- EWMA
- GARCH family (normal, t, skewed t, evt, cornish fisher)
- Realized volatility from high-frequency data
- Implied volatility from market instruments
- Model diagnostics and forecasting
- Volatility modelling approaches:
-
13:15 – 14:00: PCA and Correlation Modelling
- Estimating dynamic covariances: EWMA, rolling windows
- Multivariate volatility models:
- Constant and dynamic conditional correlations (CCC, DCC)
- Principal Component Analysis (PCA):
- Interpreting forward curve shapes
- Reducing dimensions for large correlation matrices
Hands-on: PCA on energy futures curves in R/Python
-
15:15 – 16:00: Risk in Energy Spread Trades
- Understanding spreads:
- Calendar spreads: same commodity, different maturities
- Cross-commodity spreads: different regions/commodities, same maturity
- Measuring spread VaR and ES in spread positions
- Examples of failed spread strategies and lessons learned
Hands-on: Risk calculation in Excel/R/Phyton
- Understanding spreads:
Energy Risk Modelling 2025
How can you measure, model, and effectively manage risk in complex energy portfolios?
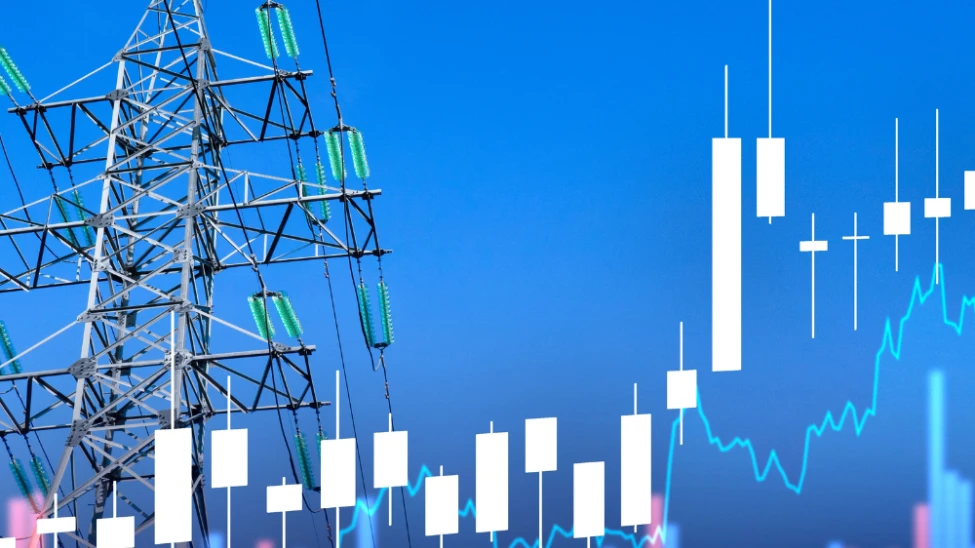
This intensive two-day course provides finance and risk professionals in the energy sector with a comprehensive understanding of corporate risk management. It blends foundational theory with advanced quantitative methods, empowering participants to identify, measure, and mitigate risks within dynamic energy markets over short-, medium- and long-term horizons.
How to measure and model risk in energy portfolios
More volatile energy markets, combined with complex trading and hedging portfolios have increased the need for measuring risk of individual contracts and whole portfolios, as well as at corporate level (Enterprise risk management). Furthermore, understanding the dynamics and determinants of volatility, correlation and risk (value at risk and expected shortfall) in energy markets is essential.
For questions, please contact:

Seminar agenda
Speakers

Sjur Westgaard
MSc and Phd of Industrial Economics from Norwegian University of Science and Technology and a MSc of Finance from Norwegian School of Business and Economics

Morten Risstad
Associate Professor Department of Industrial Economics and Technology Management Norwegian University of Science and Technology


