





-
09:00 – 09:15: Welcome and Course Introduction
- Overview of course objectives and structure
- Participant introductions and experience sharing
- Software/tools setup: Excel, R, Python
- Dataset overview: historical prices futures and spot markets, option markets
-
09:15 – 10:00: Introduction to Energy Markets and Financial Returns
- Energy markets overview: electricity, gas, oil, coal, carbon
- Spot, futures, and options markets
- Key price characteristics:
- Volatility clustering
- Fat tails and skewness
- Mean reversion and seasonality
- Return calculation and analysis
- Descriptive statistics (mean, variance, skewness, kurtosis)
- Visualization: histograms, time series, QQ plots
Hands-on: Return calculations and visual diagnostics in Excel/Python/R
-
10:00 – 10:15 Break
-
10:15 – 11:00: Risk Measures in Energy Markets
- Key measures: volatility, correlation, VaR, Expected Shortfall
- Historical vs. parametric approaches
- How risk evolves over time (e.g. rolling volatility and exponential weighted volatility)
- Interpreting and comparing tail risk in different markets for long and short positions
-
11:00 – 11:15 Break
-
11:15 – 12:00: Volatility Modelling
- Volatility modelling approaches:
- EWMA
- GARCH family (normal, t, skewed t, cornish fisher, evt)
- Realized volatility from high-frequency data
- Implied volatility from option markets
- Model diagnostics and forecasting
- Volatility modelling approaches:
-
12:00 – 13:15 Lunch break
-
13:15 – 14:00: PCA and Correlation Modelling
- Estimating dynamic covariances: EWMA, rolling windows
- Multivariate volatility models:
- Constant and dynamic conditional correlations (CCC, DCC)
- Principal Component Analysis (PCA):
- Interpreting forward curve shapes
- Reducing dimensions for large correlation matrices
- Hands-on: PCA on energy futures curves in R/Python
-
14:00 – 15:15 Break
-
15:15 – 16:00: Copulas
- Understanding tail dependencies and non-linear relationships between assets
- Understanding different stand alone distributions for different assets
- Risk management using copula models
- Hands-on: Copula-based dependency modelling in Excel/R/Python
Energy Risk Modelling Course 28-29 September
Learn how to measure, model, and manage risk in complex energy portfolios from leading industry experts Sjur Westgaard and Morten Risstad.

Energy markets are becoming more volatile. Fast.
For decades, energy markets were relatively stable, with well-understood price dynamics and manageable levels of risk. Portfolios were simpler, and risk was often assessed using static or historical approaches.
That situation has changed. Increased market integration, geopolitical uncertainty, weather-driven supply shocks, and the rapid growth of renewables have introduced new layers of volatility and complexity. Energy companies now operate across spot, futures, and options markets, with portfolios that span multiple time horizons and risk factors.
As a result, measuring and managing risk at both portfolio and corporate level has become more demanding. Understanding volatility, correlation, and tail risk, and how these evolve over time, is now essential for making informed decisions in energy markets.
What you’ll learn
This course takes a practical and in-depth look at how risk can be measured, modelled, and managed in energy markets using modern quantitative methods. It combines core theory with hands-on applications, using real market data and commonly used tools such as Excel, R, and Python.
Over two intensive days, you will learn how different risk measures behave in volatile energy markets, how advanced models improve risk estimates, and how these insights can be used in portfolio management and enterprise risk management. The focus is on understanding why models work, when they fail, and how to apply them responsibly in practice.
This training course will teach you how to:
- Measure and interpret risk in energy spot, futures, and options markets
- Model volatility, correlation, and tail risk using parametric, semi-parametric, and non-parametric approaches
- Apply and compare Value at Risk and Expected Shortfall models, including advanced methods
- Stress test energy portfolios using historical and hypothetical scenarios
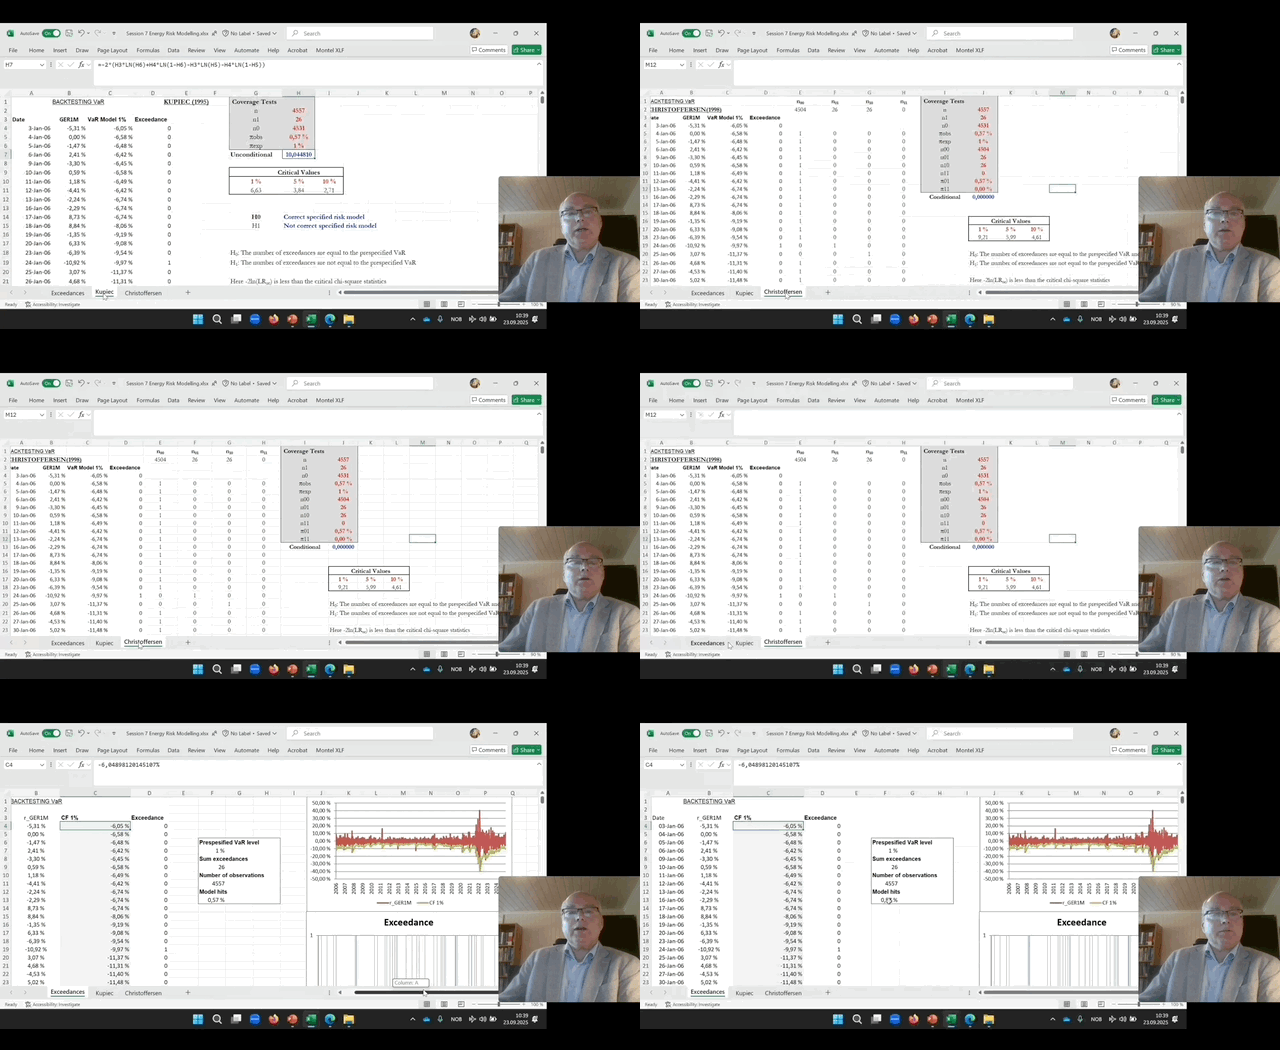
- Backtest risk models and understand their strengths and limitations
- Integrate price risk with other risk factors in an enterprise risk management context
- Use quantitative risk outputs to support portfolio and hedging decisions
You’ll benefit most from this training if you:
Work in trading, risk, or market analysis
- Are responsible for measuring and monitoring market risk
- Want to improve risk forecasting and stress testing
Manage energy portfolios or corporate risk
- Oversee hedging strategies or portfolio risk across different time horizons
- Need a stronger quantitative basis for risk-related decisions
Work with data, models, or analytics
- Use Excel, R, or Python in your role
- Want a clearer understanding of the risk models used in practice
This course is a good fit if you work with energy market risk and want to strengthen your ability to measure, model, and manage it in a practical and structured way.
You do not need to be a specialist quant, but you should be comfortable working with data, models, and quantitative concepts. A working knowledge of finance or energy markets will help you get the most out of the course.
If you are unsure whether it fits your role, just ask. We are happy to help you decide.
For questions, please contact:

Seminar agenda
Speakers

Sjur Westgaard
MSc and Phd of Industrial Economics from Norwegian University of Science and Technology and a MSc of Finance from Norwegian School of Business and Economics

Morten Risstad
Associate Professor Department of Industrial Economics and Technology Management Norwegian University of Science and Technology
Informations

Live online training

September 28, 2026
-
September 29, 2026
09:00 - 16:00 CEST on both days

1850
Delegate fee for Montel platform subscribers EUR 1572 (15% discount)
- Live online (MS Teams)
- Hands-on exercises in Excel and Python
- Q&A and group discussion
- Slide deck & resources
- 2 sessions, 7 hours each incl. breaks.
Deadline: September 24th (or until full)