







What open, high, low and close actually tell you in spot power price data
Open, high, low and close, the OHLC figures familiar from almost any traded market, summarise the first, highest, lowest and last prices recorded within a given period. In power markets, though, what those four figures represent depends heavily on how that period's price was set in the first place. A delivery hour cleared through a single day-ahead auction produces something quite different from a period traded continuously throughout the day, and reading both the same way is one of the more common ways power price data gets misinterpreted.
For traders, analysts building models around OHLC-style inputs, and anyone presenting power market data to others, understanding that distinction is the difference between a genuinely useful volatility signal and a number that looks meaningful but isn't.
What each value represents in a power price context
Open: the first traded, or cleared, price for the period in question
High: the highest price reached during that period
Low: the lowest price reached during that period
Close: the last traded, or cleared, price for the period
A key characteristic of power markets is that during auction-based sessions, a single clearing price often applies to the entire delivery period instead of a true range. As a result, the open, high, low, and close prices may all converge to the same or a very similar figure, because only one price was recorded.
It's worth being precise about what "period" means here too, since it isn't fixed across the whole market. For day-ahead data, the period is generally the delivery period itself, an hour or, increasingly, a 15-minute block, with a single value produced by that period's auction. For continuous intraday trading, the period can instead be a calendar window used for reporting purposes, such as a trading day or a session, within which many individual trades for a given delivery product are matched. Reading an OHLC figure without first checking which of these two senses of "period" is in play is one of the more common ways the data is misapplied.
Why power OHLC data differs from other markets
Day-ahead prices are typically set once per delivery period through an auction, rather than through continuous trading, which means the full OHLC concept, a genuine range building up over the session, applies most meaningfully to continuous intraday trading rather than to day-ahead data. Continuous intraday trading does generate a real OHLC range, as buy and sell orders are matched throughout the session rather than cleared all at once.
Even with continuous trading, volume tends to concentrate near gate closure as positions are finalised, which can skew where the session high and low occur relative to when most volume actually trades. Unlike most other traded commodities, power markets can genuinely trade negative prices, which matters when interpreting a low below zero: it reflects a real, if usually brief, market condition rather than a data artefact.
Reading candlestick-style charts of power prices
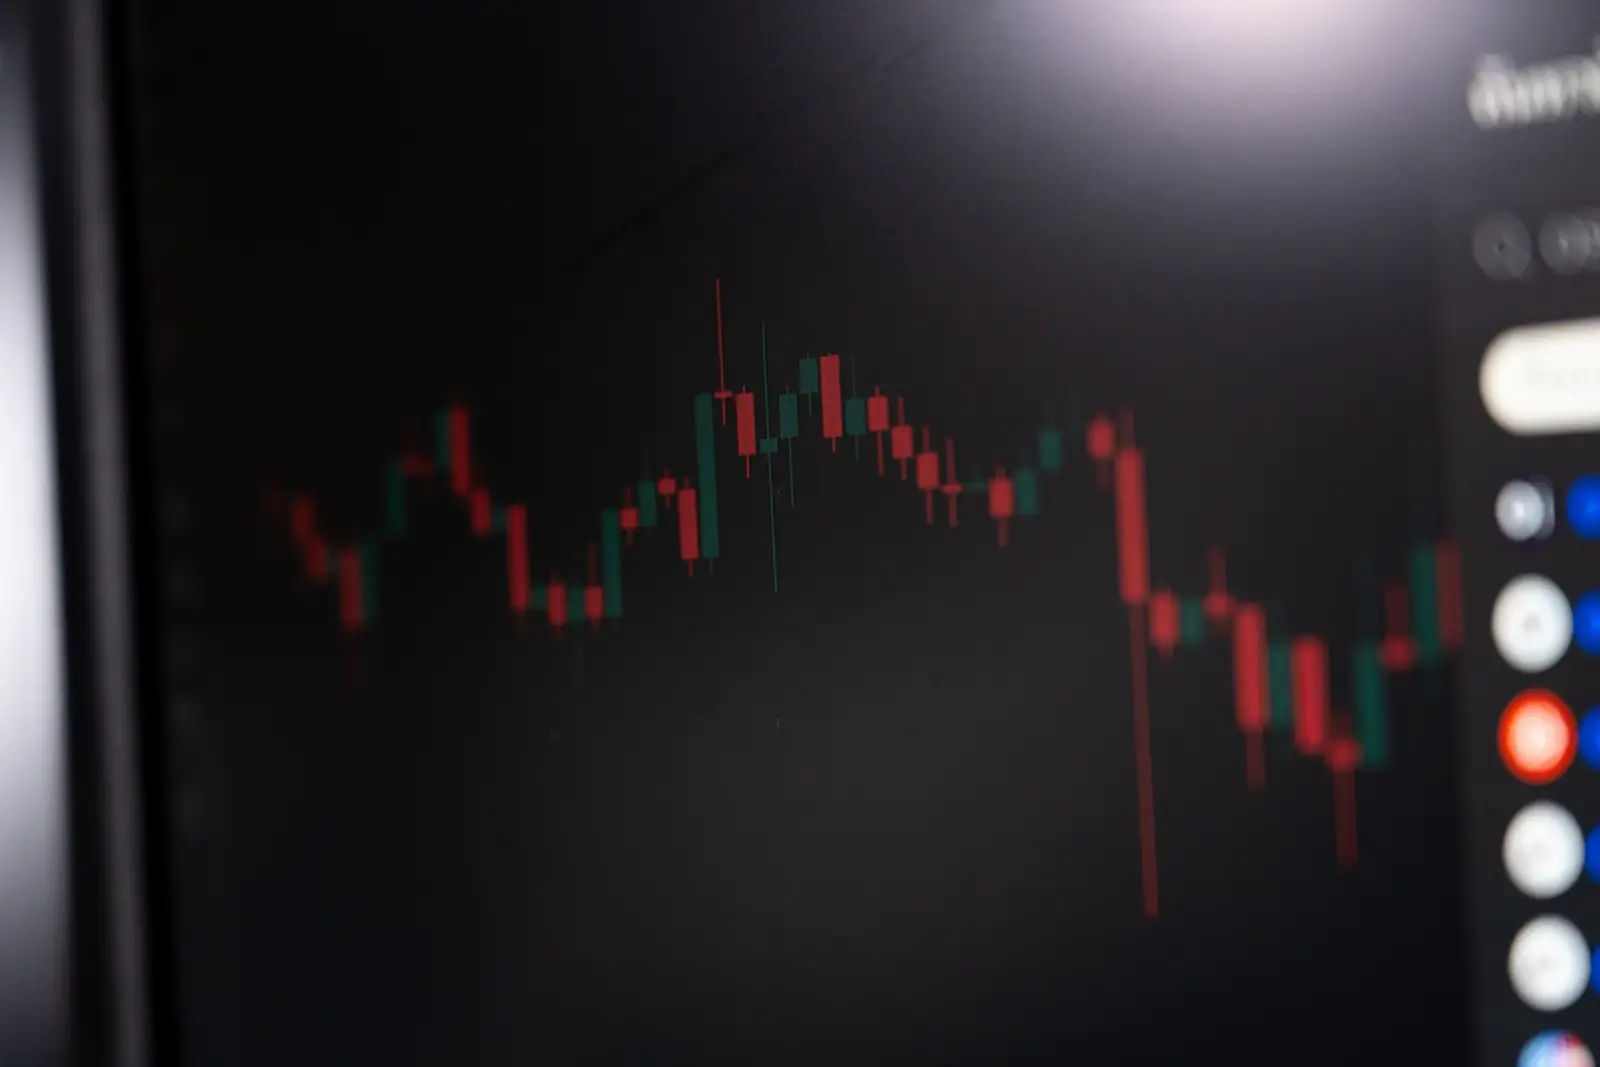
Candlestick charting, borrowed from equity and FX markets, is sometimes applied to power price data as a visual shorthand for the OHLC figures: a box spanning the open and close, with thin lines, or wicks, extending to the high and low. Where the underlying data genuinely reflects continuous trading, this can be a quick, legible way to scan volatility and direction across many delivery periods at once, as in other markets.
However, this caveat stems directly from the data. A candlestick created from an auction-cleared, single-price period appears as a flat line instead of a true candle, since there's no actual open-to-close movement or high-low range to display. Using candlestick charts without careful consideration across a combination of auction and continuous-trading periods can misleadingly suggest a level of activity or volatility in the auction-based periods that doesn't exist in the actual data.
What the range between high and low signals
Analysts building models around OHLC-style power price inputs generally treat the range, rather than open or close individually, as the primary volatility signal, precisely because it captures the full extent of movement within the period regardless of where it started or ended. That makes it a reasonably robust input for models comparing volatility across many periods, provided the auction-versus-continuous distinction discussed above is accounted for consistently across whatever periods are being compared.
A wide range between a period's high and low can indicate genuine uncertainty, or fast-changing supply and demand conditions, playing out during that session. A narrow range, by contrast, tends to suggest a well-anchored market with relatively little new information arriving to move prices around. Comparing ranges across different delivery hours within the same day can help you identify which periods faced the most trading uncertainty, rather than treating volatility as a single daily figure.
It's worth being clear about what range alone does and doesn't tell you: it shows the degree of price movement within the period, not its direction. A wide range with a close near the open is a genuinely different market condition from a wide range with a close far from it, even though both show the same high-low spread.
What open versus close can suggest
A close notably higher than the open may reflect information or conditions that shifted expectations upward as the session progressed; a close well below the open may reflect the reverse. Gaps between one period's close and the next period's open can reflect news or conditions that changed between sessions, rather than anything that happened within either one individually.
None of this is reliable read in isolation, though. Open-versus-close movement is best interpreted alongside trading volume and the broader market context for that day, rather than treated as a standalone signal of what actually happened.
Liquidity is worth folding into that context deliberately, rather than assuming it stays constant across periods. A wide range built from a handful of trades in a thinly traded delivery period signals something quite different from the same wide range built from thousands of trades in a highly liquid one, even though the OHLC figures themselves would look identical. Checking traded volume alongside the range is generally the quickest way to tell the two apart.
Practical uses and limitations of OHLC power data
Where it applies, OHLC data is genuinely useful for quickly assessing volatility and trading activity across many delivery periods at once, and for risk management it can flag periods with unusually wide ranges that merit closer attention. Its value is considerably more limited for auction-only markets, where a single reliable clearing price often applies, and the full OHLC concept doesn't have much left to describe.
Combined with volume, weather and generation data, OHLC figures can contribute to a genuinely fuller picture of a given delivery period. Used on their own, particularly for auction-based prices, they risk implying more structure and information than the underlying data actually contains.
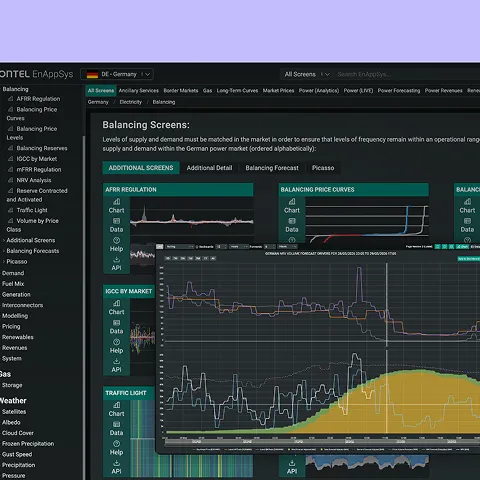
Data providers and platform developers presenting power price data face a particular version of this problem, since the same interface often needs to display both auction-based and continuously traded products side by side. Being explicit in the interface itself about which periods carry a genuine OHLC range and which reflect a single auction-cleared price, rather than rendering every period identically, goes a long way toward preventing users from reading structure into data that was never there in the first place.
Conclusion
OHLC data paints a clear picture of trading activity within ongoing sessions, showing when genuine buying and selling happen throughout the period. It's especially valuable for understanding continuous trading, where prices fluctuate as trades happen. However, for auction-based prices, which often settle on a single clearing price, this data might be less meaningful. Since the interpretation of these figures can vary depending on the exchange or session, it's a good idea to check with your data source to understand their specific conventions before making any conclusions.