







Reading LNG cargo pricing against pipeline gas benchmarks like TTF and NBP
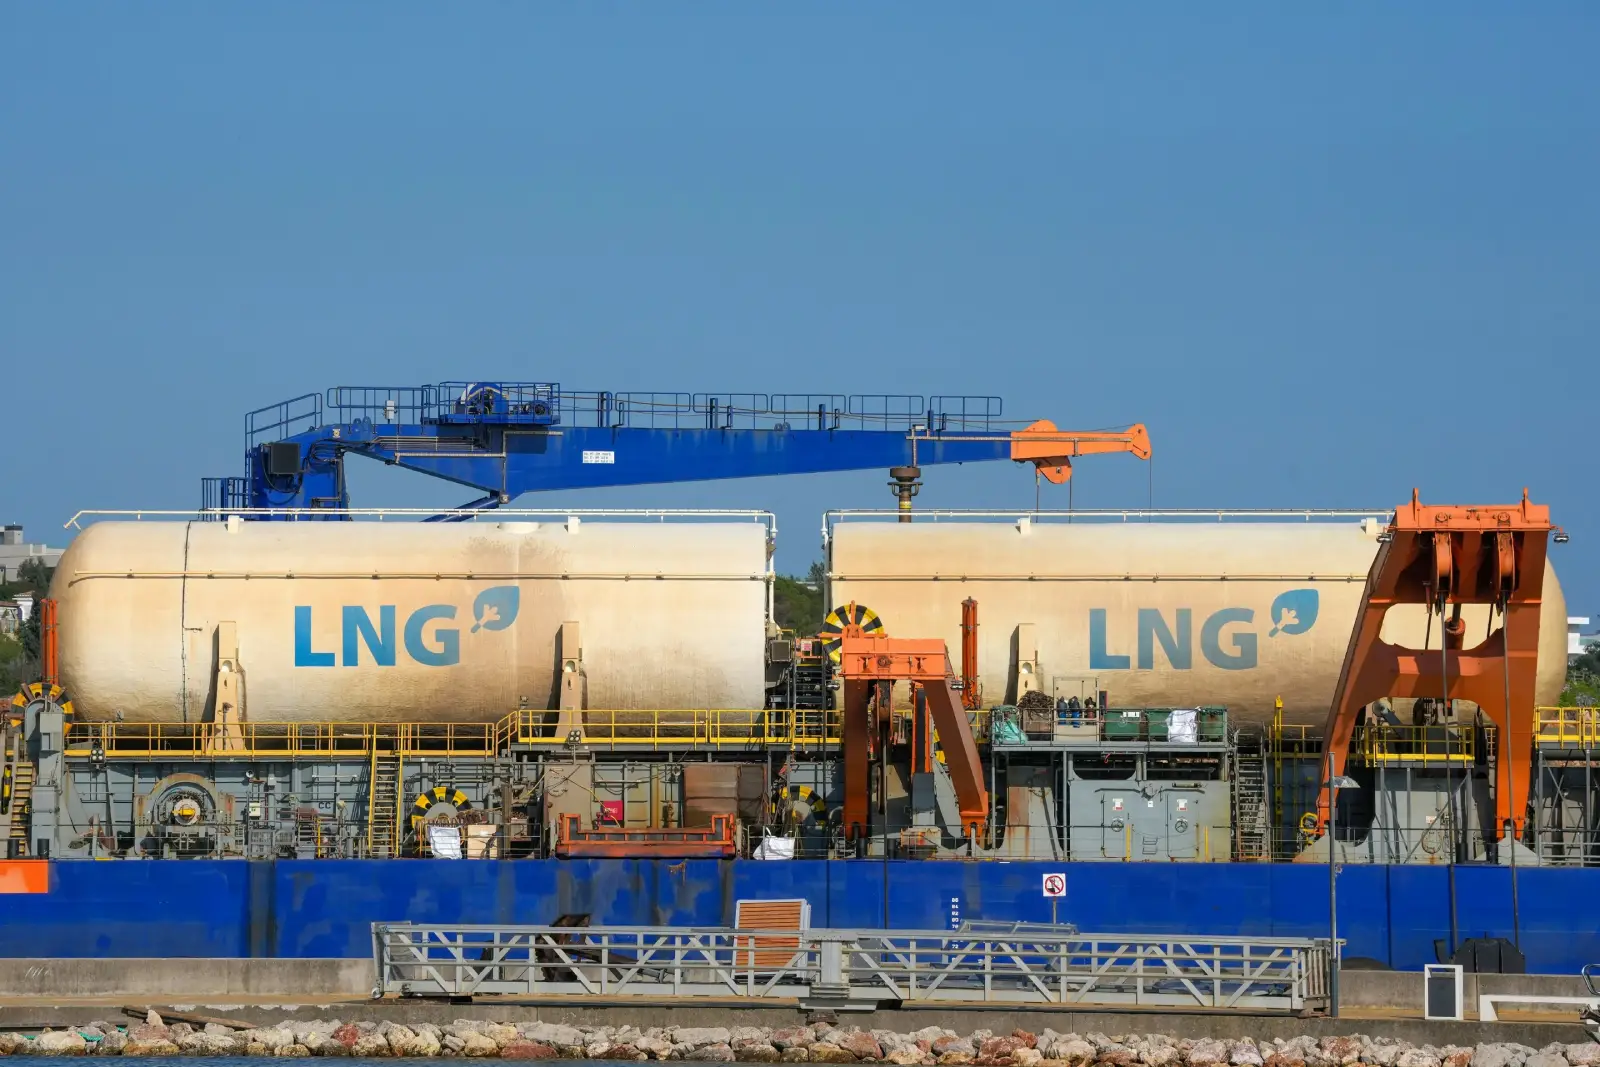
TTF (Title Transfer Facility, the Dutch virtual gas hub) and NBP (National Balancing Point, their British equivalent) are among the most commonly cited gas benchmarks in European markets. However, they do not reflect the same product as an LNG (liquefied natural gas) cargo price. Both are hub prices for pipeline-quality gas already delivered into the grid. In contrast, an LNG cargo price is usually based on delivered costs, including freight and insurance up to the discharge point, before the gas has been regasified into pipeline form. Comparing an LNG cargo price directly to TTF or NBP without adjusting for these differences can be misleading, unless shipping, regasification, and terminal fees are accounted for beforehand. All referenced price levels here are for illustrative purposes only.
For LNG traders, gas market analysts, and utilities or industrial buyers weighing LNG against pipeline supply, getting that adjustment right is what separates a genuinely comparable read from two numbers that merely appear to describe the same thing.
What TTF and NBP actually price
TTF, the Dutch hub, is now the most cited European gas benchmark; NBP, the UK's counterpart, remains historically important despite its reduced dominance compared to TTF in recent years. Both indexes refer to pipeline-quality gas already onshore and within the grid. Importantly, neither account for shipping or regasification costs, as these do not apply: the gas priced never needed sea transportation or regasification to arrive at the quoted point.
It's worth adding a third reference point here, even though it isn't a European hub: JKM, the Asian LNG marker, prices delivered cargoes into North Asia and is quoted on a genuinely comparable delivered basis to European LNG assessments, unlike TTF or NBP. When the question is whether a flexible cargo is better placed in Europe or Asia, the comparison that actually answers it is JKM against a properly adjusted TTF or NBP figure, both put on a delivered basis; JKM against unadjusted TTF or NBP repeats the same mismatch this piece is about.
What an LNG cargo price actually includes
LNG cargoes are often assessed on a delivered-ex-ship basis, meaning the seller covers freight and insurance costs until the cargo is discharged at the receiving terminal. That price reflects the commodity at the point of delivery to the receiving vessel, still in liquefied form, not yet regasified into the pipeline gas that TTF or NBP are pricing. Regasification and terminal fees are typically separate costs, incurred after the cargo has already arrived, and aren't baked into the headline cargo price at all.
Long-term LNG contracts often use pricing formulas that differ significantly from spot hub references, oil indexation, or a mix of benchmarks. This creates additional translation needs before making meaningful comparisons with TTF or NBP. A cargo priced years ago under an oil-linked formula can be far from the current spot hub netback economics, and treating that contract price as a spot assessment can lead to misleading comparisons, separate from the shipping and regasification adjustments discussed below.
Adjustments needed to compare LNG against TTF or NBP
A proper comparison means either adding estimated shipping and freight costs to a hub price to estimate what an equivalent delivered LNG cargo would cost, or subtracting those same costs from an LNG price to estimate its netback value at the hub. Where the comparison needs to reflect a fully landed and processed gas price, include regasification and terminal fees on top of freight alone.
The specific route and vessel type matter more than a single flat freight assumption would suggest, since shipping costs vary meaningfully by distance and by prevailing market conditions for vessel availability. Contract terms can complicate the picture further: destination flexibility, in particular, affects how directly any given cargo's price translates into a hub-equivalent figure, since a cargo that can be redirected mid-voyage carries a different value than one contractually tied to a single delivery point.
Two directions of adjustment are worth keeping distinct, since they answer slightly different questions:
A hub-plus-shipping figure estimates what it would cost to land an equivalent cargo at a given hub, useful for a buyer comparing LNG against pipeline supply as two ways of meeting the same demand
A cargo-minus-shipping netback figure estimates what a cargo is effectively worth at the hub once shipping is stripped out, useful for a seller or trader deciding where a flexible cargo is best sent
Both use broadly the same freight data, but starting from opposite ends of the calculation.
Why the relationship between LNG and hub prices shifts
The difference between LNG cargo prices and pipeline hub prices is not constant, as various factors influence it. Fluctuations in freight rates and vessel availability impact the base costs of transporting cargoes across regions, directly affecting the adjustments needed for comparison. One key factor is the relative tightness between Europe and Asia: cargoes that can be diverted tend to shift toward the region offering the most favourable netback at the moment. This netback depends on the price gap between regional hubs minus the shipping costs.
Seasonal demand, particularly winter heating demand, can widen or narrow regional price gaps considerably, and supply-side developments, whether a disruption to existing supply or new liquefaction capacity coming online, can shift the underlying balance between regions in ways that show up directly in the relationship between LNG and hub prices.
Practical uses of the comparison
When executed correctly, this comparison enables traders to determine whether delivering a flexible cargo to Europe or Asia is more profitable at a specific moment. It also assists buyers in evaluating whether LNG or pipeline supply provides better value for a particular delivery window. Additionally, it offers insight into why regional gas prices tend to converge or diverge over time, since much of this fluctuation results from the freight and regasification adjustments described earlier changing in magnitude.
Shipping and freight professionals sit close to the centre of this comparison, a point that's easy to overlook from a purely trading-focused view. A cargo diversion decision, redirecting a vessel already at sea towards whichever region now offers the better netback, depends on exactly the same adjusted comparison a trader would use to assess the opportunity in the first place, applied under real-time pressure and against a specific vessel's remaining schedule and contractual constraints.
Whatever the specific use, the comparison is only as good as the freight and terminal fee data underpinning it. It should be paired with current figures rather than a fixed cost assumption carried over from an earlier period, since both freight rates and regional balances can shift meaningfully within weeks.
This comparison also feeds into a wider read on the gas curve itself, in much the same way that cross-commodity relationships feed into a power forward curve, discussed in How to read a power forward curve and what it signals about future prices. A widening or narrowing gap between LNG netback values and TTF, sustained rather than a single day's move, tends to show up in the shape of the forward curve before it's obvious from spot prices alone, since forward markets are pricing in expectations about how that regional balance is likely to evolve.
Conclusion
LNG cargo prices and benchmarks like TTF and NBP are not directly comparable without accounting for shipping and regasification costs, as they reflect different stages in the supply process. The necessary adjustment varies with freight rates and regional supply-demand differences between Europe and Asia. Therefore, any comparison depends heavily on current data. For accurate live comparisons, always use the latest freight, terminal fee, and benchmark price data instead of relying on the illustrative examples shown here.