Free trial

Viking Interconnector: analysing power flows and profits

March 7th, 2024
Interconnector pipes

Ahead of Danish Energy Day 2024, Energy Market Expert, Phil Hewitt explains how trading processes work across the Viking Link interconnector, who has benefitted the most from it coming into operation and the impacts it has on European power market volumes.

On 29th December 2023 the 1.4GW Viking Interconnector linking the GB and Western Denmark (DK1) electricity markets went live.  

The interconnector is currently the longest High Voltage Direct Current (HVDC) interconnector in the world, measuring 765km. This is 45km longer than the connection from GB to the NO2 market area in Norway (which previously held the record). 

Its been an interesting first two months on the Viking Interconnector (this blog relates to analysis carried out over the period 29th December, 2024 to 4th March, 2024).  

In terms of the balance of power flows, Great Britain (GB) is importing 76% of the time, whilst Denmark is taking the power 17% of the time. 

Of course, it helps to balance the GB, Danish (and German) grids.  The interconnector is primarily traded by Danish traders who are making good money trading capacity rights on both the interconnector and in the two markets. However, German border redispatch is also finding the Viking Interconnector a useful outlet. 

This blog post will outline issues of interest after the first few months of operation and some initial impressions of the operation of the link between two dynamic and interesting markets with their own unique features.  

Day-Ahead Processes and Outcomes on the Viking Interconnector 

The operation of interconnectors are simple to explain in the European context but Viking operates differently.  

Typically interconnectors link two countries and are linked by a number of common European platforms.  

There is an auction at the day-ahead market at noon (Central European Time) where parties will buy and sell their electricity for tomorrow. This is called Single Day Ahead Coupling (SDAC) or Euphemia.  

Generally speaking, SDAC will automatically schedule the interconnectors to flow power from cheaper areas to more expensive areas. This creates lower prices for consumers. 

There is also a continuous intraday market in most European countries. These link automatically across the interconnectors and move power across borders. This enables power to flow from high priced regions to low priced regions. This is known as Single Intra Day Coupling (SIDC)

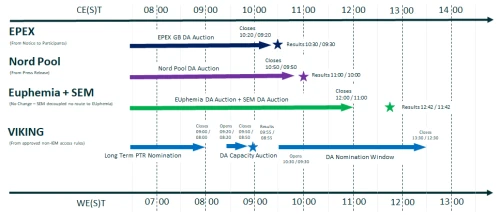
Figure 1 – Viking Link Operational Tasks at the Day-Ahead

However, for interconnectors linking into GB this is different. On 23rd June 2016, the UK voted to leave the European Union.  

The trade and cooperation agreement agreed between the UK and the EU27 resulted in GB leaving the internal energy market, as well as the common platforms SDAC and SIDC.  

This means that the scheduling of interconnectors falls back to rules used in the early 2000s.  

This explicit market coupling results in the complex events described in Figure 1.  

Traders first need to buy capacity in one direction or the other in a day-ahead capacity auction. The trader then needs to buy or sell power in auctions in GB and then complete the counter trade in the Danish auction. 

Generally speaking, this convoluted approach is risky and results in more expensive transactions across the interconnectors. 

It also results in flows at the day-ahead stage which do not necessarily match the price delta between the two markets.  

Much debate exists about whether optimising the flows at the day-ahead on price is the correct outcome for the market. Especially as there is usually redispatch on the interconnectors as the market moves closer to the point of delivery. Renewable energy outputs mostly drive this in line with changing weather conditions. 

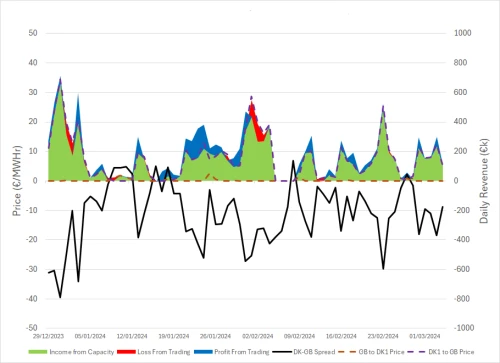
So how does this play out on the Viking Interconnector? Figure 2 shows the revenue that parties receive via the link. 

Traders makes profits on flows as long as the spread between the markets is big enough and the cost of capacity is cheap enough. 

Figure 2 also shows the spread between Denmark and GB. If Denmark is more expensive, then the price will be positive. If GB is more expensive, then the price will be negative.  

The spread is then split between the cost of capacity and profits for traders - who are speculating on the spread between the two markets.  

The chart shows that the majority of the spread is captured by the interconnector owners.  

The remainder of the spread is captured by the traders who are forecasting the outturn of the prices in the GB and DK1 price zones, before using this to bid for capacity on the interconnector. 

Figure 2 – Day-Ahead Revenues on the Viking Interconnector

 Income from the trading on the Viking Link over the analysis period is distributed as follows: 

  • €10m from capacity sales (money to Viking which is split between 50/50 National Grid and Energinet) 

  • €2m from trading profits on the interconnector that went to capacity purchasers, i.e. traders. 

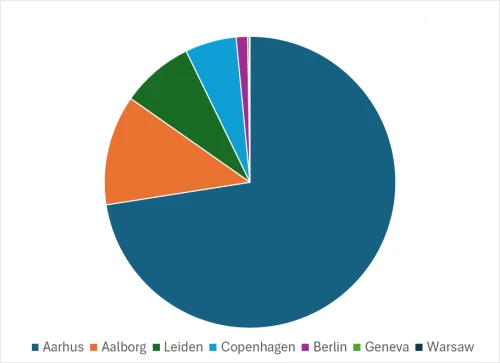
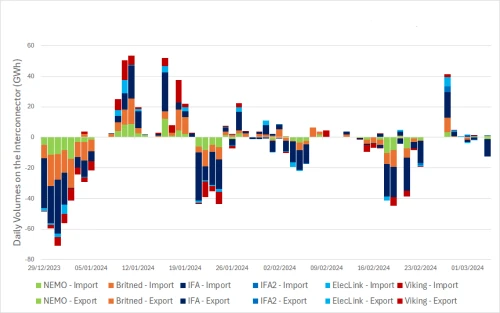
Using data from GB we can see the identity of the traders on the interconnector. We have anonymised the traders to a degree by splitting them into the city where they are based.  

Figure 3 – Gross Final Delivered Volumes on the Interconnector

Danish traders are responsible for 90% of nominated volume on the interconnectors. It would therefore be fair to assume they have captured 90% of the revenue. 

Learn to take advantage of similar opportunities
Balancing the GB Grid using the Viking interconnector 

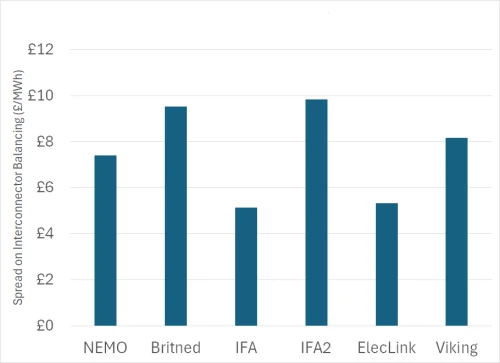
Figure 4 – Balancing Volumes by Interconnector

National Grid ESO, the electricity system operator for GB, uses trading on interconnectors to balance the electricity system.  

They currently trade the French, Belgian and Netherlands interconnectors. The addition of Viking means they now have more trading opportunities. 

 Figure 4 shows the balancing volumes by interconnector. You can see that National Grid ESO has used Viking for the whole period.  

Individual trades made by counterparties are published to the market in GB. This allows us to carry out analysis on the profitability of each trade.  

The numbers show us that trading with NG ESO is generally price equivalent with the other interconnectors. These figures take into account transmission losses and value against the average hourly weighted average price. 

Figure 5 – Spreads for balancing trades across the interconnectors

Looking for more insights into Danish Energy Markets
Redispatch of German Border 

Total capacity on the Viking interconnector is rated at 1400MW. However, it is currently limited to 800MW.  

The reason for this is system stability in the DK1 region. To address this issue, Energinet and Tennet are building the West Link connection on the western side of Denmark. This will improve the links between the DK1 price zone and Germany. The current completion date is the end of 2025. 

However, operators can still sometimes push the Viking link from the 800MW base capacity to the full 1400MW capacity. 

This typically occurs when the DK1-DE border is being reversed. In practical terms this is when export to Germany is zero. Or Denmark could potentially import power from Germany.  

This builds a requirement for the DK1 zone to start sending power to neighbouring countries.  

When this situation occurs, Energinet and NG ESO increases the available transfer capacity into GB at the intraday stage. 

The additional 600MW of capacity allows power to be moved into GB, providing an outlet for the excess (and cheap) power coming in from Germany. 

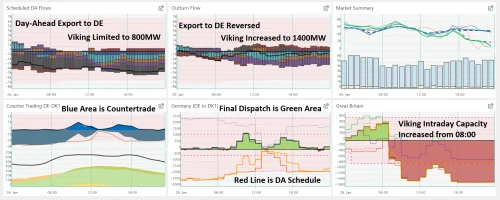
Figure 6 is a screenshot from the Montel Analytics EnAppSys platform showing how this works in terms of redispatch. 

Figure 6 – Screenshot from Montel Analytics EnAppSys platform showing impact of TSO countertrading on Viking Link on 26th January, 2024

The day-ahead scheduled flows on the Viking Link are scheduled in the day-ahead market. These are shown as GB importing 800MW from 07:00 onwards. (Pictures Bottom Right and Top Left).  

The German border flows are scheduled with an outflow to Germany for most of the day at the day-ahead stage. 

When the German redispatch is carried out, the flow out to Germany is zeroed and in some cases reversed.  

This additional volume in DK1 has to have an outlet, which is achieved by curtailing generation, as well as increasing exports to GB and NO2. 

Want to know more about cross-border power flows throughout Europe?