Free trial

German solar investment: turning energy markets upside-down?

April 8th, 2024
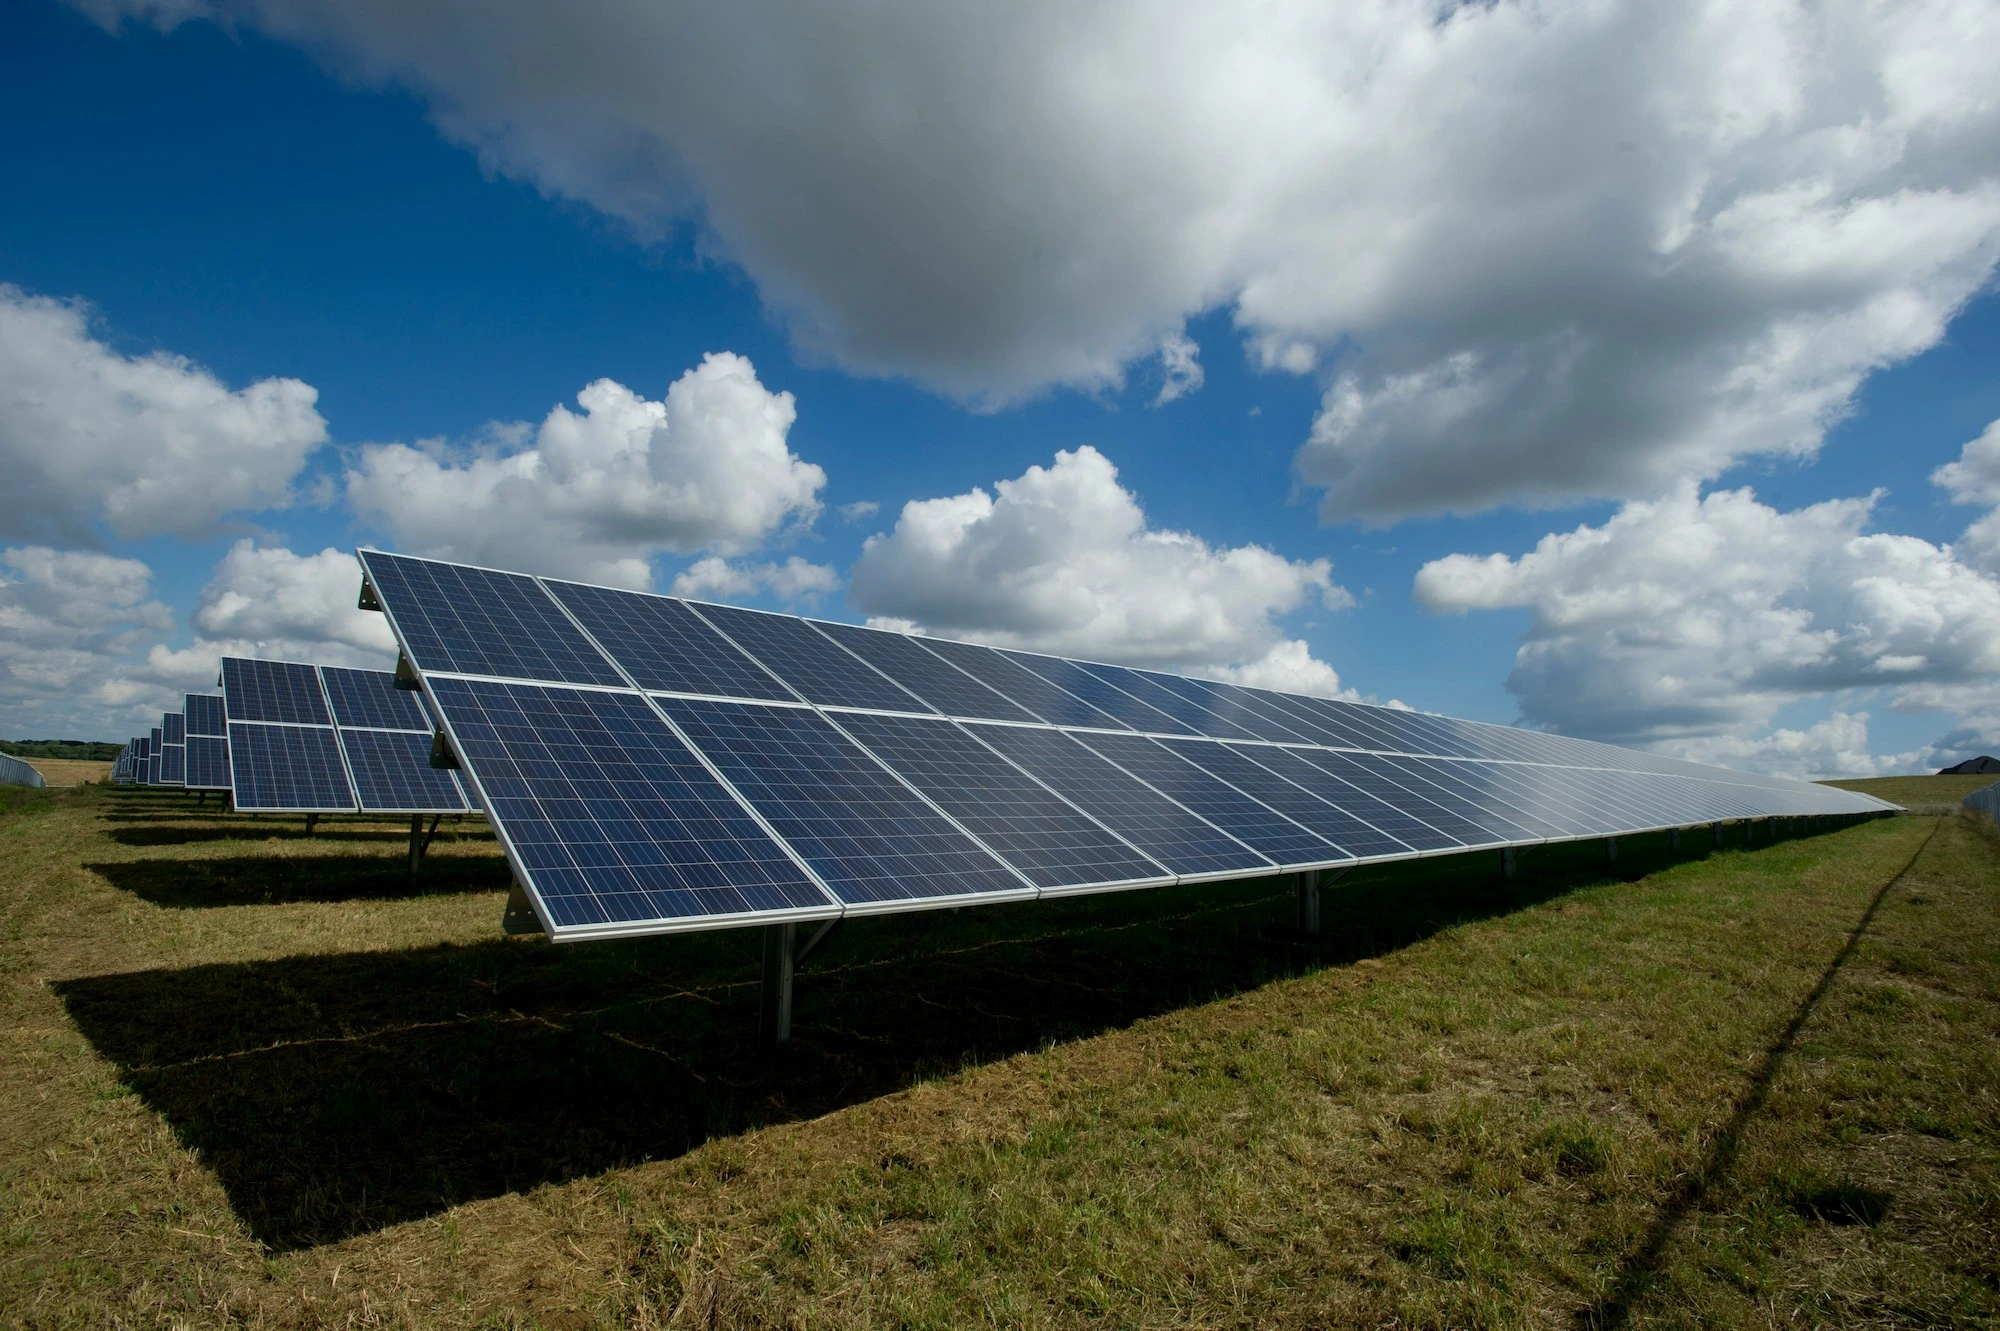
Solar farm Germany

Market Expert Jean-Paul Harreman explains how a new wave of solar power installations could have significant impacts on negative pricing in the German power market.
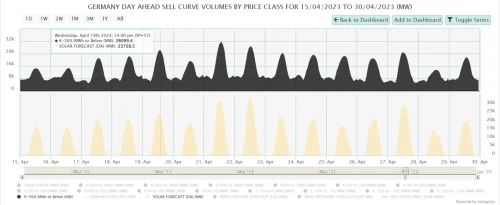
On 19th April 2023, energy markets faced a second day ahead auction for the first time ever. This is because the lower threshold (-€150 at the time) for holding a second auction was broken.  

Almost one year on from that event, we decided to analyse the changes that have taken place since then and how that could affect the coming spring and summer’s day ahead markets. 

During 2023, the share of renewable energy across the European fuel mix continued to grow rapidly. In Germany, this led to drastic reductions in emissions. Even despite the shutdown of the last German nuclear power plants. A massive 14 GW of additional solar capacity was installed in the country last year - a truly unprecedented level of growth.

Solar bidding behaviour on the exchange 

To understand the impact of additional solar capacity on the local market, we need to assess how solar forecasts affect bidding behaviour in the day-ahead market.

Figure 1 - Screenshot of DE DA Sell Curve Volumes By Price taken from Montel EnAppSys platform

In the above chart we can see a massive correlation between the solar forecast and bids that are in the auction at a price of -€500. This is what is known as the ‘must-sell’ price. 

On April 19 last year, the difference between the night-time must-sell volume and the solar-peak must-sell volume was roughly 20 GW (with a 24 GW solar forecast).  

If we do this analysis over the months of April to September, the ratio of solar vs additional must-sell volume during the solar peak is an average of roughly 70% in Germany.

Looking for data like this?

Simulating the impact of additional solar 

If this behaviour continues, another 14 GW of solar capacity could potentially add a peak must-sell volume of 9.8 GW. Just to reassure you, we can say that this is unlikely to happen.  

Interestingly, new capacity will fall under the new EEG-rules. This means that subsidies are voided if there are 4 consecutive hours of negative prices. Secondly, experience from traders and portfolio managers will also feed into bidding strategies. 

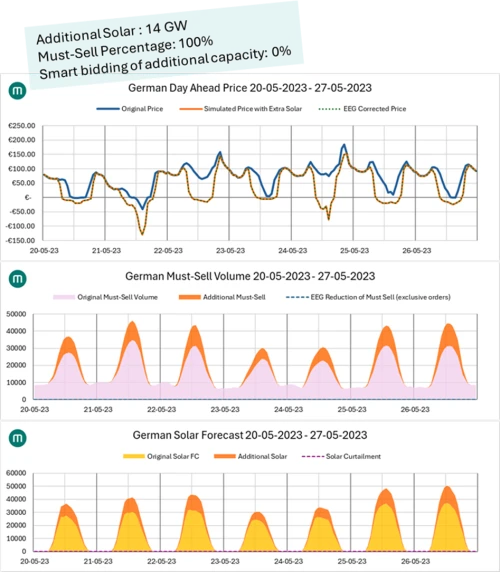
The chart below outlines how this theoretical scenario would look for the week of 20 to 27 May. Prices would drop significantly and stay low for longer due to the large addition of must-sell volume from solar generation. 

Figure 2 - DE Worst Case Scenario Simulation

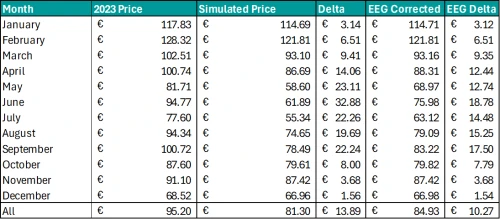
In the worst case scenario, where 100% of the new solar is bid in as -€500, the 2023 prices would drop by nearly €27! This would also result in 1600 hours of negative prices.  

Of course this is not entirely logical, so let’s assume that 70% of the additional volume will be bid in at -€500, similar to last year. Without an intelligent bidding strategy for the new solar production, this would still drop prices by nearly €24 and result in over 1400 hours of negative prices  

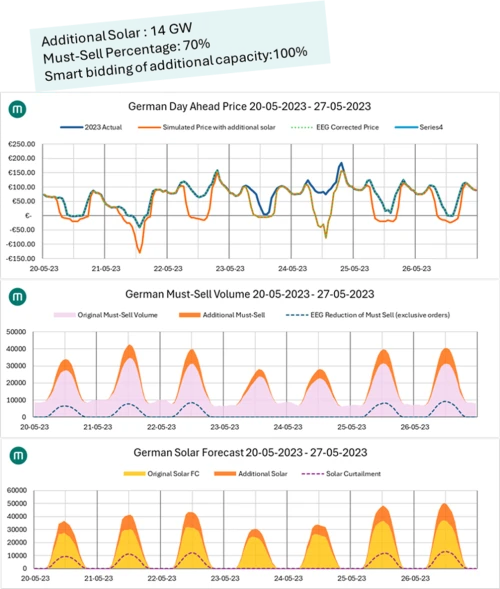
So what would happen if everyone bid solar generation at a price of zero when more than 4 hours of negative prices were recorded, and 70% would be bid in at -€500 by default? Even in this scenario, prices would still drop by €11 and result in around 650 hours with negative prices. 

For the week of the 20th of May, we can see (below) that this would result in less additional must-sell volume and significant day-ahead price driven solar curtailments.

Figure 3 - DE May 20-27 Simulation

So, if we assume the new capacity will be bid in similarly to the existing capacity, we may see some very extreme moves in the market. 

Comparison to the Neighbours 

So how does this work in other markets with large solar capacities? If we look to the Netherlands, only 30% of additional solar tends to be bid in at -€500.  

The respective volumes at -€500 to -€100 are larger than in Germany, due to the way the market is organised. New capacity does not receive SDE subsidy for any negative price hours either. This provides a good incentive to avoid bidding in at ‘any price’. We tend to see only non-dispatchable generation being bid at -€500. 

If we disregard the impact of Germany on the Dutch market (which was a fair assumption to make in 2023, when Netherlands was exporting mostly during the solar peak) we see a drop of average day ahead prices of around €5 if no smart bidding is used. This reduces to just under €3 if 100% smart bidding is used. With the excess solar power inevitably spread across these markets, we can expect to see greater price convergence.. 

If we apply the average Dutch parameters to the German market, with 100% smart bidding for the additional capacity (and around 30% of the additional volume coming in at -€500) we observe an average annual price drop around €10, resulting in around 675 negative price periods. 

Figure 4 - DE Data Table

Where we do see more negative prices, we don’t see the prices dropping to a -€500 clearing price more often than before. It looks as though 2024 is unlikely to see more of these events. Unless there are capacity restrictions or other incidents, we should not see many of these price limit breaches.

Conclusions: Minimum exchange price to remain at -€500 

From the above we can draw some interesting conclusions. Note that the data used was based on 2023 actuals, which was not a particularly sunny summer in Germany. But within the context of that, we can safely say we are expecting a significant increase in negative prices. 

A lot of the effects of the additional solar generation can be mitigated by bidding the forecasted generation in as smart orders or at price levels above -€500. 

It will be critically important to monitor the bidding behaviour on the power exchanges in relation to solar forecasts in the coming months as the market finds out just how much solar is effectively added to the energy mix and how this affects the power flows across the continent.

Find out more about the data and forecasts that make this analysis possible: